
Below is a brief guide of how to use our reports and their features. Among the reports where you will find these features are the Inspections Summary, Hours of Service Summary, Speed Violations, Shift Summary, Fuel Tax Summary, and more. There may be some variation between reports of various features. For additional information on specific reports please see the following link: Reports
Table of Contents
Report Sections
Print, Export, Settings and Report Buttons
Query
Filters
Aggregates
Data Table
Data Table in Detail
Headings and Subheadings
Sorting
Column Management
Breadcrumb View
Examples - Sample Reports
Report Sections
Print, Export, Settings and Report Buttons
Found in the top right of the report, these allow the following:

Print - Print the report you're currently viewing.
Export - Export your current report into an excel or CSV spreadsheet.
Settings - Change your personal settings for report viewing. These include display and export formats and have options for time, distance and speed, duration, mileage and volume.
Report - Similar to a "file" menu, allows you to start a new report, save your current report, open a saved report among other similar features.
If you are viewing the Hours of Service Summary Report you will see an additional option:

Data Transfer - Allows you to email your RODS in the correct format to either:
General Purpose - to an individual
US Audit - to the applicable US government agency
Canada Audit - to the applicable Canadian government agency
Query
The Query area is the identifier of what data is showing up in your report.
When opened, the default query is loaded.
Clicking in the query area allows you to add to or change the existing query. Data will update automatically.
Reset your query back to the default by clicking the options button (3 dots) on the right, then clicking "Reset panel to default".
Collapsed Query view

Expanded Query view:

Filters
This area shows you any filters on your current query/report.
Click into this area to add or modify a filter. Data will update automatically when a new filter is added.
Clicking any underlined value in the data table will automatically add that value to your filters.
Reset your filters back to the default by clicking the options button (3 dots) on the right, then clicking "Revert Panel to Default".
You can remove outliers and statistical anomalies from your report by using the options provided in the "Additional Filters". There are some other options in here as well that may be useful in building specialized trip reports for your needs.
When opened, the default query is loaded.
Clicking in the query area allows you to add to or change the existing query. Data will update automatically.
Reset your query back to the default by clicking the options button (3 dots) on the right, then clicking "Reset panel to default".
Collapsed Filters view:
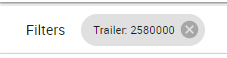
Expanded Filter view ( Filter options may vary between Reports):

Aggregates
Shows an aggregation of your currently active query and filters.
Clicking this line provides more detailed information and aggregation.
Data Table
The line at the top (with the magnifying glass) allows you to quickly search your full data table (below) for values.
The full data table is the "meat" of your report.
Data is shown with a number of headings and columns which can be customized.
More information about the data table is in the section below.
Data Table in Detail
Headings and Subheadings
Each report has a series of headings and subheadings that organize that data you're viewing.
The first row is generally viewed as sections for the headings and data below them. i.e. Trip Resources and Route.
Below each section heading are further subheadings for the data you're viewing such as Start Time, Vehicle and Trailer(s).
Sorting
Click any subheading to sort that column.
Click again to change the direction the data is sorted (ascending or descending).
Column Management
Each heading or column of data has an options button.
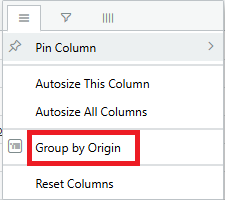
Put your mouse on the heading, then click the details/options button (3 horizontal lines) to access the column management features.
Features include:
Pinning - Pin a column to the left or right side of the report so it's always visible no matter how far you scroll left or right.
Grouping - Changes the way your report is presented by first grouping your data by values contained in the columns you chose to group by. A new group subheading is added to the left side of the report that includes the grouping data. To remove the grouping, press the 'x' button beside "Grouping Active" that will appear to the right of the Data Table Search heading.
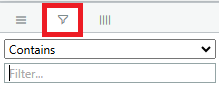
Advanced Filtering - After clicking the options button, more buttons appear right beside it. The second button allows you to create an advanced filter in that column using expressions such as "contains", "equal", etc. This filter is only on that column and does not apply to the whole data table.
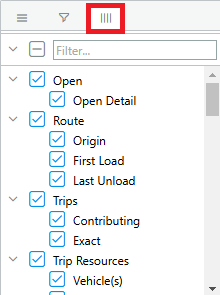
Add/Remove columns - Beside the filter button is the "columns" button. Clicking this will show a list of all columns in the data table. Unchecking a box will remove that column from your report so you can hide unnecessary data. To add them back, press the same button and check the appropriate box once more.
Breadcrumb View (not available on all reports)
One column on the report looks like a Google Maps "Pin".

Clicking on this icon in the column will take you to a special map showing the route the driver took on this trip.
A legend is shown at the upper left of the map to help you read it.
You can zoom the map with your keyboard and mouse. Hold down the CTRL key on your keyboard and scroll using your mouse or touch pad to zoom in and out. The + and - buttons in the corner will also help you zoom in and out.
Google street view is available on this map as well. Drag the little orange person onto any highlighted blue area to access.
Examples Using The Trip Summary Report
Example 1
All trips this week ending at a certain location:
Click into the Query field at the top and change the Date Range field to "Last 7 Days".
Click into Filters and change the Unload Locations field to the area you're interested in.
Hide any columns you're not interested in by pressing on the options field of any column, pressing the columns icon, and un-checking the fields you don't want to see.
Apply an appropriate sort to your data by clicking on the heading of that column.
Export or print your report by using the buttons at the top right of the screen.
Example 2
Be emailed a report of all trips for the day the following morning:
Click into the Query field at the top and change the Date Range field to "Yesterday".
Hide any columns you're not interested in by pressing on the options field of any column, pressing the columns icon, and un-checking the fields you don't want to see.
Apply an appropriate sort to your data by clicking on the heading of that column.
Click on "Report" in the top right of the screen and select "Schedule Report".
Enter the email address you'd like to receive the report at in the "Deliver to" field.
Day is already selected and is the only option in the "Every" field.
Select a time in the morning you'd like to receive the report. Put this time in the "At" field.
If you have a certain time you'd like to stop receiving this report, enter it into the "Until" field.
Click "Save and Schedule" when finished.
If you have any questions regarding How to Use our Reports, please contact Navistream Support.
Navistream Support
1(844)571-8200 Ext 2
navistream@stti.ca